HSAC is a student-run organization at Harvard College dedicated to the quantitative analysis of sports strategy and management. This blog features the original contributions of Harvard undergraduates, graduates, faculty, and affiliates. HSAC does research for several sports-related publications and companies. Please contact us at harvardsportsanalysis@gmail.com if you have any questions or want more information.

Posted in Uncategorized | Comments Off on

WE HAVE MOVED OUR SITE!

Check it out at: http://www.harvardsportsanalysis.org


Posted in Uncategorized | 2 Comments

NFL Gambling as an Alternative Asset: Abstract

The following is the abstract from the paper “Using the NFL Gambling Market as an Alternative Asset Class” by Kevin Meers, Sam Waters, and Zack Wortman. Please find the full paper here. We will publish our projected probabilities each week before NFL games begin, starting for Week 2.

A particular focus of modern portfolio theory involves diversifying risk through identifying and investing in assets that are uncorrelated with one another. In this pursuit, many investors have explored so-called “alternative asset classes” that are not traded on major stock markets. In this paper, we identify the market for gambling on games in the National Football League (NFL) as one such alternative asset. By modeling various betting outcomes, we develop multiple betting algorithms that provide returns from 7% to 20%, depending on what level of risk the investor would like to assume. These returns are, in theory, totally uncorrelated with market risk, and therefore valuable to any portfolio manager; further, they appear to dominate multiple market indices.


Posted in Uncategorized | 4 Comments

HSAC on Gammons Daily

HSAC member Oliver Kim analyzed Ike Davis’s career over at Gammons Daily. A quick tease to whet your appetite…

“On Saturday, the Mets’ sometimes-first baseman Ike Davis strained his oblique, potentially ending his season and with it, his career with the New York Mets. Davis has only been in the major leagues for four seasons, yet in that short time he has charted one of the strangest career paths in recent years.”

Read on here.

Posted in Baseball, MLB Baseball | Leave a comment

HSAC’s Fantasy Value Handbook, Part II

Part II: Turning Weekly Performance into Seasonal Value

by Sam Waters

This is the second section of our guide to calculating player value in fantasy football. Each part will lay out a different aspect of the process. Part I is already up, and Parts III, IV, and V will be published on our blog throughout the week. For those with drafts this week, you can find a preliminary auction values chart at the end of this article.

shiva

Welcome to Part II of HSAC’s Fantasy Value Handbook. When I left you in Part I, I had declared my intentions to create a new system for assessing player value in fantasy football. I started by explaining why the objective-weekly approach can help you more accurately value players and ultimately hoist your fantasy league’s championship trophy in January. Now, in the second part of our series, I am going to lay out the first steps in creating this new system.

We ultimately want to project the value of each draft pick in 2013 using the actual values of each draft pick from 2008 to 2012. Before we can do that though, we have to figure out how valuable each player actually was over those last five years. This particular section is dedicated to making that calculation.

As I explained in Part I, we need to use each player’s weekly values to calculate their seasonal values. Each week, we can find a player’s value by taking their fantasy points and subtracting the fantasy points of a hypothetical replacement level player. This value metric is called Points Above Replacement, or PAR for short. The equation for Tom Brady’s PAR in a given week would look like this:

Brady’s PAR = Brady’s Points – Replacement’s Points

This is how we measure the value of every player in each week. Once we have all of these values for each player season from 2008 to 2012, we can just sum them up to get every player’s total seasonal value. And after we have the seasonal value calculations, we can move onto using them in our projections for 2013.

So far, it sounds like all we have to do is a little addition and subtraction before we have the value of every past player. Unfortunately, the one thing I left out above is actually calculating replacement level, and we have some work ahead of us in order to accomplish that. We’ll start with the first and simplest step, checking your league’s settings to see how many players you have to start at each position. We’ll use a standard ten-team league as an example.

Each team starts 1 QB, 5 FLEX (RB/WR), 1 TE, 1 DEF, and 1 K, so between ten teams the whole league starts 10 QB’s, 50 FLEX’s, 10 TE’s, 10 DEF’s, and 10 K’s. If you are in a competitive league where everyone pays attention (we’ll get to how this changes things later), approximately the ten best QB’s, fifty best FLEX’s, ten best TE’s (and so on) will start. This lowest ranked starter at each position is our weekly replacement level.

It was easy to find the positional ranking of the replacement level player, but now we need to figure out how many points he is expected to score. Thanks to ESPN’s archives, we can do this by using their weekly consensus rankings from the past five years to predict actual fantasy points. For each position, we’ll fit a regression model to the data that projects an expected fantasy point total given a player’s ranking that week. If we want to know how many points the replacement level player is expected to score, we just plug his ranking into the model. Before I show you the replacement levels that this process generates, I’ll go through and explain the key takeaways and results of each positional model, moving from the position with the most predictable performance to the ones with the least. That means that we start with running backs.

Screen shot 2013-09-03 at 3.19.11 AM

The best fit for weekly performance at running back, like performance at all other positions, is a quadratic model. This means that the expected difference in performance between two players decreases as rank goes up. In other words, there’s a bigger difference between Adrian Peterson and the number two running back than there is between the number twenty-nine and the number thirty running back. When we want to know the expected performance of any player specifically, we can just plug their rank into the model. If our replacement level running back is ranked twenty-seven, for example, the model tells us that his expected performance, based on similar players over the last five years, is 8.6 points. But we don’t just want to know the expected level of performance at each position; we also want to know about the amount of variation in that performance.

The r-squared value for running backs is 0.2, which means that 20% of the variation in fantasy points for a player in a given week can be explained by their rank. This is a higher r-squared value than any other position. A higher r-squared value means the experts found the position more predictable, so either running backs are easier to forecast or the experts just allocate more of their time to running back analysis. Let’s take a look at the next two most predictable positions, quarterback and tight end.

Screen shot 2013-09-03 at 3.19.01 AM      Screen shot 2013-09-03 at 3.19.25 AM

With r-squared values of 0.11 and 0.09, respectively, quarterbacks and tight ends finish in the middle of the pack in predictability. While their variance is similar, they lie on opposite ends of the spectrum in terms of absolute point scoring. The quarterback replacement level is the highest of any position at 15.5, while tight ends bring up the rear with a replacement level of 6.3. Remember though, value is not all about how high or low the replacement level is- it’s about the spread between the good and bad players. And with the steepest curve of any position, elite quarterbacks separate themselves from their high-scoring replacements with performances that are relatively far superior. The tight end curve is also fairly steep, with more differentiation than wide receivers, but less than quarterbacks. Speaking of wide receivers…

Screen shot 2013-09-03 at 3.19.18 AM

With an r-squared value of .07, wide receivers are still closer in predictability to quarterbacks and running backs than they are to the more volatile defenses and kickers. However, the wide receivers are more similar to the kickers in that their curve is pretty flat; the model doesn’t predict much better performances for highly ranked receivers than it does for lower ranked ones. On a seasonal basis, wide receivers do get more of a chance to establish themselves, but with the small-sample size randomness of a single game at play, weekly performances at this position differ less than you think between the A.J Green’s and Anquan Boldin’s of the world. Where wide receivers are pretty similar but at least a little predictable, kickers and defenses accomplish neither.

Screen shot 2013-09-03 at 3.19.57 AM     Screen shot 2013-09-03 at 3.19.38 AM

With r-squared values of .03 and .003, defense and kicker performance appears close to random. To be fair, defensive performances are a little more patterned and a little more differentiated, but still don’t stack up against the other positions. Kickers, meanwhile, are in a different stratosphere than the other positions in terms of randomness. There is basically no relationship here between rankings and fantasy points. If you’re agonizing over whether to start Stephen Gostowski or Matt Bryant in Week 1, just flip a coin.

Okay, so after we’ve avoided spending ten minutes deciding between kickers by spending ten minutes deciding between heads or tails, we’re ready to calculate our positional replacement levels. Since positional performance varies from season to season with league-wide changes in strategy, we’ll use a separate regression model for every position in every season. After we have those models set, we can plug in our replacement level players’ rankings to get their expected points. Here are the results:

Screen shot 2013-09-04 at 12.55.44 AM

Now, if we want to figure out a player’s points above replacement for any week, we take the appropriate replacement level given his year and position and subtract it from his actual points scored. This is only for projected starters though (players ranked in the top 50 for FLEX, top ten for all other positions); projected bench players cannot accrue PAR. We do this because without a reasonable expectation that a player would start, he can’t provide any value that week to your team since he’s not in your lineup. Barring projected bench players from accruing value helps our system better evaluate two types of players in particular, inactives and “out-of-nowheres.”

Out-of-nowhere players are guys who had fluky performances that no fantasy owners started. In real life, these players didn’t actually help any fantasy teams, so we need to value them in a way that accounts for this. Whether the Texans third-string tight end scored zero points or fifty, no one owned him, so assigning him a no-value-added PAR of zero is appropriate.

While discrediting fluky performances, PAR actually boosts the value of injured or bye week players. If we didn’t automatically assign them a zero, inactive players would get credited with negative PAR, because they didn’t play. But if you knew they weren’t playing, you got to start someone in their place, a replacement player. So on average, you’ll get replacement level points when your guy gets hurt or is on bye, making zero PAR, rather than negative PAR, an accurate description of your hobbled would-be starter’s value.

Once we calculate the weekly PAR of every projected starter and assign zero PAR to every projected bench player, we just add up each player’s PAR for all seventeen weeks to get his total PAR for the season. Now we have a full-season value measure for every player over the last five years, and we can move onto projecting full-season value in 2013. This will be the focus of Part III, “Projecting Seasonal Value.” Thanks for sticking around, and if you’re getting antsy to just move on to the final results, Part V will be up early next week. For those with drafts this week, here is the chart of auction values by positional rank for a ten-team standard league:

Screen shot 2013-09-04 at 1.18.07 AM Screen shot 2013-09-04 at 1.18.40 AM Screen shot 2013-09-04 at 1.21.44 AM Screen shot 2013-09-04 at 1.22.17 AM

Posted in Fantasy Sports, NFL Football, Uncategorized | Tagged , | 5 Comments

HSAC’s Fantasy Value Handbook, Part I

This is the first section of our guide to calculating player value in fantasy football. Each part will lay out a different aspect of the process. Parts II, III, IV, and V will be published on our blog throughout the week.

adrian-peterson3

To Purple Jesus or not to Purple Jesus? Every auction owner has to decide whether to shell out the big bucks for the services of his holiness. (Photo: Sports Illustrated)

Part I: We Need A New System

By Sam Waters

Every year, millions of fantasy football owners spend months agonizing over their teams in pursuit of that one elusive championship. On this noble quest for fantasy glory, an owner must make a host of decisions that greatly impact their team’s performance. Each of these strategic choices boils down to maximizing one thing: value. The owner that drafts, trades for, picks up, and starts the most valuable players has the best chance to win. But determining a player’s fantasy value is not an easy task. If it was, you would be spending a lot more time with your friends and family instead of reading articles like this one, and Mathew Berry would have to go back to writing Crocodile Dundee sequels.

In an effort to promote stronger social bonds, this series will aim to make managing your fantasy football team easier. I’ll realize these lofty aspirations by establishing a novel approach for assessing fantasy football player value and explaining how to implement it on your road to the title. By laying out the whole process, I hope to give you a comprehensive understanding of everything you need to know about value in the fantasy football player universe. That way, you won’t just know that Adrian Peterson and other studs are way, way undervalued, but you’ll know why they’re way, way undervalued. Now that I’ve told you the big news about AP, don’t go jetting off to repair your neglected relationships. Fantasy is more important than friendship. And my self-esteem really needs the page views.

So… we’ve established our ultimate goal for this series: to create a new, more effective system for valuing players in fantasy football. I guess that means it’s a good time to actually explain what this system is.

My technique starts with the idea that the performance of players in previous years is a good barometer for what to expect from players this year. Using the last five NFL seasons, I’ll examine the relationship between players’ preseason expert rankings and their actual in-season fantasy value. This data will enable me to build models that predict the value of similarly ranked players this year, and place an expected point total or auction price on every player from the first-ranked quarterback to the fiftieth-ranked running back.

This process sounds straightforward enough, but it gets complicated when we need to decide exactly how to measure fantasy value. If we don’t get this measurement right, our results will be misleading, because we’ll be predicting something that looks like value, but isn’t. That is why this system’s efficacy hinges on its ability to calculate fantasy value in a way that more accurately portrays each player’s contributions in comparison to other methods.

From here on out, we’ll call this new value measurement technique the “objective-weekly” approach. This approach starts by taking the last five NFL seasons and calculating every player’s weekly fantasy value. We then sum up these weekly values to get each player’s full-season value. Next, we use expert pre-draft rankings to model these seasonal fantasy values, and find the expected seasonal value at each pre-draft ranking. Now, all we have to do to get to our final draft pick valuations is make some adjustments for free agency and other quirks of the fantasy football rulebook, and we’re done. This doesn’t sound too crazy (or maybe it does, who am I to judge my own sanity), but the objective, weekly nature of this system actually deviates a fair amount from what most major websites use. Let’s examine what the prevailing practices are, how they differ, and why they fall short.

In opposition to the objective weekly approach, we find what I like to call the “seasonal-subjective” approach, which seems to be the most popular technique out there. The seasonal-subjective approach starts with relatively subjective full-season player projections from experts. The experts then take their raw projected point totals for each player and adjust by position, usually subtracting the projected points of the worst starter at the position of the player in question. In this way, they get a value measure that tells them how many points more each starter was worth than the worst-case alternative. This worst-case player is known as the replacement level, and using him to adjust for position scarcity is a good way to measure value (One that we will also incorporate later).

So what’s the problem with this method? It seems pretty simple and it leans on some strong concepts. Well, as you might have guessed from its name and my skepticism, the subjectivity of the projections and the seasonal basis of the value calculation are big obstacles. It’s important to understand why an objective projection beats a subjective one and why a value calculation that starts with weekly performance is more accurate than one that starts with seasonal performance. Let’s start by looking at the difference between an objective system and a subjective one.

Many of the expert staffs that make fantasy football projections have a wide range of skills that they utilize appropriately to help with their jobs: communicating ideas clearly, breaking down game film, interpreting coach-speak, synthesizing local news sources, getting yelled at by Skip Bayless…. The list goes on. Subjective player projection is not one of these things. Though they may try, it is impossible even for experts to remain unbiased when making subjective predictions. This is true not only in fantasy, but in almost any arena that demands gut-call predictions of an uncertain future. Different experts will all have different biases about certain types of players, which will unavoidably affect their judgment. Not only do they suffer from varying individual biases, but almost all of them fall prey to a particular foe: the lure of optimism.

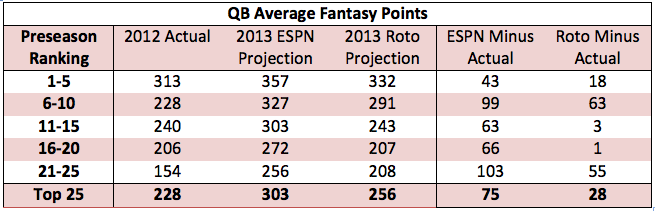
Across the board, expert projections are clearly too optimistic. It’s easy to imagine what a player’s stat line might be in the preseason when he is “in the best shape of his life” and his preseason stats are off the charts. It’s a little harder to imagine and then incorporate into your prediction all of the ways in which those rosy conditions could deteriorate for your stud first rounder or superstar-in-waiting sleeper. Just look at ESPN’s and Rotoworld’s projected fantasy points for this year’s quarterbacks compared to the actual performance of quarterbacks with the same rankings in 2012:

Screen shot 2013-09-02 at 1.24.54 AM

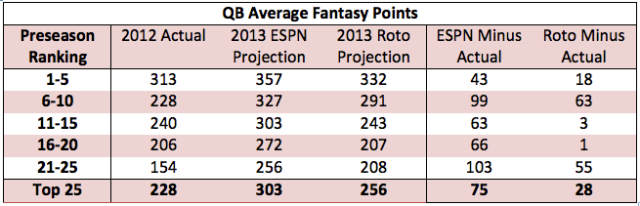
ESPN projects the average top 25 quarterback to improve by a whopping 75 points, while Rotoworld projects him to improve by a still far-off 28 points. For ESPN’s projections to be accurate, every top 25 quarterback would have to improve by an average of 875 yards and 10 touchdowns. This doesn’t pass a sanity check. Rotoworld is closer, but still not in the realm of feasibility. I mean, I know the NFL is getting more pass-heavy, but unless teams start running up NFL Blitz-style scores, this obviously isn’t happening.

Even if the experts are too optimistic, you might think that relative player values will stay the same, since every player gets a bump. This isn’t the case though, because while the ordering of quarterbacks won’t change, the spread between them will. If you take another look at the chart above, you’ll notice that the difference between the 1-5 QB’s and the 20-25 QB’s is 58 points higher in real life than in the ESPN projections (and 35 higher than Rotoworld’s). The experts underestimate the overall gap between good and bad fantasy quarterbacks. This matters, because it is the spread within each position that determines the value of its players. Between this systematic issue and case-by-case bias toward individual players, subjective projections can create a very warped value measurement. I know it already looks like the websites using subjective projections are in trouble, but just wait until we talk about the issues with the seasonal aspect of their method.

The seasonal method ultimately falls short because it reduces a player’s contributions in a complex game to one simple number. If fantasy rosters locked in August, you could just forget about your team until December, find out how many points each of your players scored, and have a pretty clear picture of what happened with your team that year. Everything would be fine (and pretty boring). But we all know this is not the case.

Fantasy football is a complex game played on a week-to-week basis, so it shouldn’t be surprising that value needs to be calculated in a sophisticated way to reflect this sophisticated format. There is weekly variation in each player’s outlook caused by injuries, matchups, and byes that you just don’t capture if you start with a player’s point total for the season alone. Everyone knows that these short-term effects are real, but they might not realize why it makes a difference. Let’s start with an example from a fictional ten-team standard league.

It’s the preseason, and you want to calculate the expected value of your starting quarterback, Ben Roethlisberger. Conveniently, your seasonal approach fantasy football tutor has some advice ready. He tells you to subtract the amount of points that you expect Ben’s hypothetical replacement to score from Ben’s projected points. This will enable you to see how many points Roethlisberger is going to gain for you, he says. Right now, you have Big Ben as the eighth ranked quarterback, projected for 260 fantasy points. You have Eli Manning ranked tenth, projected for 240 fantasy points. Being the tenth quarterback and worst projected starter, Eli is your hypothetical replacement. So for the whole season, Ben should be worth twenty extra points over replacement using the seasonal approach.

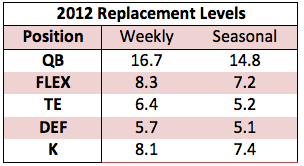
The issue is that even though you think Ben will be the eighth best and Eli the tenth best each week on average, you know that there will be some weeks where Eli has bad matchups (or worse, injuries) and his rank drops, and some weeks where he has good matchups and his rank rises. What the seasonal approach doesn’t account for is that during those weeks when Eli drops out of that top ten “reasonable starter” territory, you could be starting a hot free agent or a bench player in a projected shootout who has higher expectations for that week than Eli. So if you take Eli in the thirteen weeks where he is in the top ten and some short-term upstarts in the four weeks where they are in the top ten, your cumulative replacement level player will be better than just having Eli for all seventeen weeks. For this reason, instead of subtracting the fantasy points of the season’s tenth ranked quarterback from Ben’s to get Ben’s value, we need to subract the fantasy points of every week’s tenth ranked quarterback. This applies to all positions. The replacement level player when calculated on a weekly basis is always higher than the same one calculated on a seasonal basis. Just take a look at a comparison of the expected replacement levels at each position based on 2012 weekly data and 2012 seasonal data:

Screen shot 2013-09-02 at 1.23.11 AMThis trend of higher weekly replacement levels holds across the other years in our study too. The higher replacement level causes mediocre players to depreciate, while elite players gain value, so this distinction has a significant effect on how we view value at each position. Once you understand how these two types of replacement levels work, it is clear that the seasonal approach does not accurately reflect value under the standard format of fantasy football, and that ignoring this issue leads to an incorrect evaluation of the whole player pool.

Now that we’ve established why the objective weekly approach leads to a more accurate set of player evaluations than its subjective, seasonal counterpart, it’s time to put it into action. The upcoming installments of this series will lay out, in detail, all of the steps taken using the objective weekly approach to project the point values and auction prices for players at every pre-draft ranking slot. The whole process will be broken down into the following parts:

  • Calculating Weekly and Seasonal Value
  • Projecting Seasonal Value
  • Making Seasonal Value Adjustments
  • The Final Value Chart and Strategy Discussion

If you’re eager to find out exactly how this method changes player values from what you’re used to seeing on sites like ESPN or Yahoo, you can always skip ahead to the chart at the end (Part V). As for everyone else… Speaking as a completely unbiased party, I think I’m pretty trustworthy. But if you’re not into blindly accepting stuff some random guy on the internet told you without any explanation, I’m looking forward to spilling my fantasy football soul over the next however many pages. We’ll kick things off tomorrow by talking about how to calculate weekly value in Part II. Now, if you’ll excuse me, I have some waiver wires to scour.

Posted in Fantasy Sports, NFL Football | Tagged , | 10 Comments

What Were the Chiefs Doing?

By David Freed

With the NFL’s first regular season games looming, now seems like a good time to revisit key offseason transactions and discuss how they might actually impact the performance of certain teams. Today we’ll focus on the Chiefs.

An ESPNInsider post by Matt Williamson lauds the Kansas City Chiefs for a series of moves that transformed the franchise. Out were Matt Cassel, coach Romeo Crennell, wide receiver Steve Breaston, and former no. three pick Glenn Dorsey. In came Alex Smith, Andy Reid, Donnie Avery, Mike DeVito, Anthony Fasano, and Sean Smith. Williamson argues that “the Chiefs roster has vastly improved in free agency,” and has previously said that he thinks, “a playoff berth certainly is not out of the question” for next season. While the Chiefs have certainly been active, I contend this offseason has hurt the franchise.

Some of the biggest news this offseason was that Kansas City sent a second round pick this year and a conditional pick in 2014 to the San Francisco 49ers for quarterback Alex Smith. Smith was a below-average NFL quarterback for almost his entire time in the Bay Area. Forced to acclimate to a different offensive coordinator every year, no coach was able to build a system to complement his skill set. He never recorded a positive Win Probability Added.

Then Jim Harbaugh came in. Smith suddenly posted a combined 1.49 WPA while completing more than 60 percent of his passes. Conversely, Cassel committed 18 turnovers in just nine games last year. The Chiefs finished 2-14, and management cleaned house.

The difference between these two quarterbacks is more perception than reality. The upgrade between the two is minimal, and certainly not worth the value the Chiefs gave up. As discussed before, Smith has never posted a WPA over 0.89—good for only 22nd in the league that year—and his only two positive seasons came with the best offensive line in the league (according to Pro Football Focus) in front of him and defenses selling out to stop the run. Smith completes a lot of passes but for few yards; his adjusted yards per attempt peaked last season at 5.7. That mark would not have ranked in the top 32 passers.

Cassel, on the other hand, was an above-average quarterback the other two years he was in Kansas City. The former Patriot posted a WPA above 1.00—more than Smith ever has—in each of his first two years with the team. In 2011, Cassel had more WPA in nine games than Smith did in 18, averaging four times as much WPA per game. Cassel put on this performance despite a much worse cast around him than Smith had in San Francisco.

Smith’s fit in Reid’s scheme is also questionable. Over the past two years, Smith was sacked 2.7 times a game on 26 dropbacks behind the best line in the game. Despite playing behind an average offensive line (12th in the league by Pro Football Focus), Cassel was sacked only 2.3 times a game on 30 dropbacks over that same period. Transitioning into Andy Reid’s offense where getting the ball out quickly is important, Smith’s tendency to take sacks should raise a red flag. Similarly, as Grantland’s Chris Brown notes, Reid’s West Coast was at its best when “it was as much about throwing vertically—with deep passes to Terrell Owens or DeSean Jackson breaking open a game—as it was about short passes underneath.” Smith’s inability to stretch the field is another problem sign for the Chiefs.

We haven’t even addressed the cost that the Chiefs gave up. Keeping in mind the second round pick they gave up is at the very top of the second round and using Kevin Meers’ chart of draft value, we can see the pick the Chiefs gave up (no. 34 overall) is worth about eight-ninths as much as San Francisco’s first-round pick (no. 31 overall). Giving up what was basically a late first round pick for a marginal quarterback upgrade is clearly not worth it. Further, as discussed at length in Cade Massey and Richard Thaler’s paper, the surplus value generated from that pick is significantly more than the value Smith’s contract ($8 million per year) provides over its duration. Add in that the Chiefs aren’t currently developing a young successor and brought in undrafted 26-year old Chase Daniel (he of nine career NFL pass attempts) as a backup, and the organization’s plan for the future at the NFL’s most important position is very murky. The Chiefs could have gotten a quarterback for their future—Florida State’s EJ Manuel or Tennessee’s Tyler Bray—with this pick for a fraction of the cost.

Overpaying Dwayne Bowe presents another misstep. Bowe, who is being paid with his new contract (five years, $56 million) like a top five receiver, was the 56th best wideout last year by DVOA. He has never been higher than 18th, and has been outside the top 50 in two of the last three years. For perspective, the player ranked right above Bowe—the Rams’ Chris Givens—will make nearly half a million next year, about 1/22nd of what Bowe will bring home for similar production.

The damage report largely ends there. Signing the underrated tight end Anthony Fasano—who has dropped only three passes in three years—was good value for the Chiefs. Fasano will provide a safety valve for Smith and, having rated in the top six of Pro Football Focus’ blocking rankings in four of the past five years, will open up holes in the running game for tremendous running back Jamaal Charles. Waiting until the market died down to sign cornerback Sean Smith to a three-year, $18 million deal was good value for a decent cornerback. Although Smith ranked as only the 52nd best in the league in coverage, according to Pro Football Focus, he is still an improvement for a secondary  (30th in the league in allowed YPA) that never recovered from posing Brandon Carr last offseason. Paired with Brandon Flowers, ranked 9th by the same metrics, Smith could help the secondary regain some respectability.

In the larger picture, however, it is hard to say that the Chiefs got more than marginally better over the course of the offseason. This Chiefs team does not look drastically different than the versions that went 17-15 the two years before this one. Smith may be two years younger than Cassel, but he may have already reached what has been a pretty low ceiling for a former no. 1 pick. After being left with hoards of cap space by Pioli, new management has locked a lot of it up in overpriced commodities (Albert, Smith, Bowe) whose NFL resumes are long enough to cement them as forever good-but-not-great. A couple extra wins this season may keep the current management employed, but the Chiefs’ current and future on-field product isn’t getting any closer to elite.

Posted in Football, NFL Football | Tagged , | 1 Comment

End the Tyranny of the Six Nations: Let Them Play!

By Julian Ryan

The Six Nations rugby tournament has established itself as the premier rugby competition in the northern hemisphere. Originally starting with the home nations of England, Wales, Scotland, and Ireland in 1883, the French joined in 1910, and Italy was added in the 2000 season. Winning a ‘grand slam’ has become the ultimate aim for any competing team in a non-World Cup year, and so prevalent is it that Argentina even wanted to join.

Living alongside this tournament in almost utter obscurity is the second tier European Nations Cup. This tournament is played annually and remarkably features 36 different European Nations – I for one had no idea so many countries even had a rugby team. There are seven divisions with two tiers and a complex promotion/relegation system, but whoever wins the inventively titled “Division 1A” is crowned the champion.

Over the past years, a mini-dynasty has formed as the small but proud nation of Georgia has risen to form a veritable powerhouse. Georgia has won the last three championships and five of the last six. The other “giant” is Romania, who drew 9-9 with Georgia in the de facto championship game, allowing Georgia to win on point difference. Between the two of them, Georgia and Romania have won all the tournaments but one since Italy joined the Six Nations in 2000.

As these teams continue to dominate, the time has come to ask whether it is fair they are not given the opportunity to compete at the highest level of European rugby. In 2000, Italy was given a chance to simply join, but were they better at that time than Georgia and Romania are today? Let us compare each team’s respective performance over three seasons to look at the relative strength of the teams.

Italy 1997-99

Georgia 2011-13

Romania 2011-13

Overall Winning Pct.

0.479

0.674

0.543

Average Point Differential

-10.6

+10.6

+3.8

World Cup Record

0-4

1-3

0-4

Average World Cup Point Differential

-44.8

-10.5

-31.3

European Nations Cup Winning Pct.

1.000

0.900

0.700

Average Point Differential in European Nations Cup

+30.0

+20.5

+13.9


The data suggests that Italy heading into the 2000 season was not distinctly better than the top Eastern European teams are now. It should be noted that back then the European Nations Cup was not as established, so the teams Italy destroyed by an average of thirty points were not as good as those Georgia and Romania are playing today, with the emergence of Spain, Portugal, and Russia, in particular (and each other). In addition, I should point out that Georgia’s sole World Cup victory did actually come against Romania.

The Italians were a team that got absolutely shellacked 101-3 by New Zealand at the 1999 World Cup, just six months prior to turning it around and beating Scotland in their first ever Six Nations. To me, any argument that Georgia and Romania would not be good enough to hold their own against the premier European teams is not compelling. Scotland scraped past Georgia 15-6 and Romania 34-24 in the 2011 World Cup, and if Italy were let in after their mammoth loss to the All Blacks, the drubbings England handed out to both Georgia and Romania should be similarly discounted.

In my opinion, the most logical system would be one of promotion and relegation, as the bottom team drops out of the Six Nations each year, being replaced by the European Nations Cup victors. For too long, Eastern European rugby has been ignored. If the Six Nations let Italy in back in 2000, they simply have to give these up-and-coming teams a shot.

Posted in Uncategorized | 3 Comments

Calculating the Ridiculous Physics of Disney’s Hercules

By Anthony Zonfrelli and Dmitri Ilushin

This post can also be viewed on Deadspin here.

Disney’s Hercules: the classic tale of the clumsy boy blessed with superhuman strength who fights to become a hero to rejoin his family on Mount Olympus. With the help of his goat-man trainer, Philoctetes, Hercules learns to use his incredible gift to “Go the Distance,” performing all kinds of outrageous physical feats.

In order to give Hercules his due —  and to judge Disney’s ability to follow the rules of the known universe — we looked into the physics behind these feats to better appreciate how otherworldly his strength really was. I don’t care if I’m watching a movie with shape-shifters and talking tornados -– I want to see some consistency.

We see Hercules’ first truly impressive feat of strength during his teenage years, when he is seen sprinting down a barren road with a cart loaded with an incredible amount of hay bound for the marketplace. Eager to help out, Hercules lifts the entire haystack, but his father tells him to wait by the cart while he haggles with the local hay-mongers. A chastened Hercules then drops the haystack back onto the cart, causing the cart to launch his father’s donkey, Penelope, into the sky. With a few assumptions and basic kinematic equations, we can dig a little deeper into Penelope’s wild ride through the clouds.

herc1

Poor Penelope was in the air for 7.7 seconds of screen time. With this measurement alone, we can deduce that she reached a maximum height of 73 meters, meaning she went on a ride higher than the eighth-tallest roller coaster in the world without so much as a seatbelt. Furthermore, we estimate that the g-force required to catch Penelope — a task Hercules managed with little to no stress — exceeds 19 g. Keep in mind that anything over 25 is likely to result in serious injury or death to a human (and probably a donkey). At Penelope’s speed, the force of the catch is equivalent to her crashing the cart into a telephone pole at 84 mph.

herc2

To propel an average-sized donkey that high, the mass of the haystacks must have totaled 12,864 kg (28,360 lbs), which didn’t seem to faze Hercules, who managed its weight with one arm. What’s less clear is how Hercules’ father expected Penelope to lug over 14 tons of hay into town. Donkey rights have come a long way.

herc3

We fast-forward past a strenuous Danny DeVito training program, when Hercules takes his first pass at being a hero. Two boys are trapped in a rock quarry, begging someone to “call IX-I-I.” Hercules sees his big chance and hefts the enormous boulder off of the boys, presses it up over his head, and saves the day.

From a screenshot, we estimate that the boulder has a radius of approximately five times Hercules’s height (6’5”, according to legend). Using this measurement and Wolfram Alpha’s estimate of the average density of rock, we find that the gargantuan boulder weighs nearly 23 million pounds. In non-rock terms, this is equivalent to the weight of 575 Greyhound Buses or nearly 2400 African elephants. Had this task been conducted in an official competitive setting, Hercules would have shoulder pressed 44,000 times the world-record weight.

herc4

Soon after achieving hero status, Herc engages in that other favored pursuit of teenage males: chasing tail. After wooing the beautiful Megara, Hercules apparently gets a boost of testosterone from falling in love and goes straight to the arena to lift weights with his flying horse pal, Pegasus. In a fit of youthful exuberance, Hercules jumps off the high bar and deep into the night sky, achieving an absurd hang time of 30.1 seconds — long enough for evil demons Pain and Panic to capture Pegasus by shape-shifting into a sexy Pegaslut (complete with tramp stamp) and luring him into their clutches.

Using the same method we used to calculate Penelope’s height, and taking into account the standard height of a high bar, we find that Hercules took off with an incredible velocity of 147.6 m/s (330 mph) and reached a towering height of 1,113.7 meters (3,654 feet). Let’s put that into perspective – the Empire State Building is 1,250 feet tall, the Sears Tower is 1,450 feet tall, and the tallest building in the world, the Burj Khalifa in Dubai, U.A.E., is 2,717 feet tall.

herc5

To figure out what kind of view our hero enjoyed from that height, we’ll need a lesson in geometry. We only need two pieces of information: Hercules’s maximum height and the radius of the Earth. Knowing that the line of Herc’s vision will be tangent to Earth’s surface, we can make a right triangle with this point on the horizon, Herc’s viewpoint, and the Earth’s very core. Taking the inverse cosine of the ratio of R/(R+h), we can figure out angle x. Then using tan(x), we can find d.

herc6

This calculation shows that Herc’s spectacular view is over 74 miles in any direction, nearly twice as far as one’s view from the top of the Eiffel Tower. Assuming his training area is located in the center of Thebes, he can see well past all of Athens and into the Aegean Sea.

The evil Hades greets Hercules upon his return to Earth, and in exchange for Megara’s promised safety and Pegasus’s release, Hercules agrees to give up his strength for 24 hours while Hades unleashes the Titans in an attempt to overthrow Zeus and take control of Mount Olympus. The deal is confirmed with a dramatic handshake that sucks the power right from Hercules’s body. But there’s only one problem with it – they shake with their left hands. In what universe is that deal legal and binding? Hercules might as well have just crossed his fingers behind his back if this is what constituted a legitimate, godly contract in Ancient Greece.

herc7

After a brief interlude involving a tender love scene and the recovery of his strength, Hercules chases down Hades and joins the gods in the war against the Titans where he performs his final, absolutely ridiculous feat of strength. Hercules grabs the tornado Titan, Stratos, and swings him around until he has sucked up all of the bad guys, and, in super slow motion, hurls them all into outer space. Where they explode. This feat exhibits incalculable strength, and the explosion in space breaks all kinds of laws of physics. I cannot even begin to understand, let alone explain, how it all transpired.

herc8

The rest is (ancient) history. Hercules takes a dip in the underworld, reviving Meg, and restoring order to Mount Olympus. Take it away, Hades.

Posted in Uncategorized | 3 Comments

TEBOW TEBOW TEBOW: Is Tim Tebow Capable of Adding Value to New England’s Offense?

By Anthony Zonfrelli

It’s “Tebow Time” in New England. The Patriots’ signing of the former Broncos star and Jets backup has catalyzed yet another mass analysis of the poor guy. All of New England is now wondering, “What in the world could Tim Tebow possibly add to New England’s powerhouse of an offense?”

The statistic posted in various places by ESPN suggests that Tebow actually hurt the Jets’ offense last year, averaging 3.8 yards per play when he was on the field versus 4.7 yards per play when he sat.  But this doesn’t quite encapsulate the Tim Tebow experience. For one, it includes plays in which Tebow simply handed the ball off, where he likely had little to no effect on the play. What the New Englanders really need to know is how well Tim Tebow did in situations where he will be relevant.

It’s common knowledge by now that Tebow is probably best suited in short yardage situations, using his size, athleticism, and childlike enthusiasm to get those tough first downs. It is highly unlikely that the Patriots will ever try their luck with Tebow on 1st or 2nd down when they have an elite quarterback like Brady at their disposal, let alone permit him to chuck the football. Instead, the Patriots are probably only looking to use him as a pounding running back when they would have otherwise risked Brady’s health by sneaking him up the middle. So how well did Tebow do in these situations?

Using play-by-play data from Advanced NFL Stats, I compiled all rushing plays by the Jets on 3rd or 4th down with less than 5 yards to go. Rather than simply comparing Tebow plays versus non-Tebow plays, I looked specifically at plays where Tebow made an impact – only plays where Tebow actually ran with the ball. I found that, when rushing the ball on 3rd or 4th down with less than 5 yards to go, Tebow averaged 2.86 yards per play, while the rest of the Jets averaged only 2.00 yards per play.  Furthermore, Tebow converted every first down when he had to go less than 5 yards to attain it; his only shortcoming resulted from a single 3rd and 5 attempt.

In the situations that mirror those in which New England expects to see him, Tebow provided nearly an additional yard of value for his former team. The Patriots can use Tebow’s dependability in these 3rd and short situations, granting them the privilege of not having to risk their starting quarterback. Brady will no longer have to grind his way through the trenches with the obedient Tebow at the ready. That said, Brady is certainly no slouch when it comes to short yardage situations; as Bill Barnwell noted on Twitter, Brady is 18-for-19 in converting 4th and 1 sneaks since 2002.

Still, it appears as though the Patriots may have found yet another valuable role player to add to their roster. Either that, or Belichick is just using Tebow for information on the Jets (we wouldn’t put it past him) and will dump him by the end of training camp. Once the season comes, we’ll see if Belichick deems Tebow’s athleticism and divine touch worth the media circus that will likely follow him to New England.

Posted in Uncategorized | 3 Comments

YouTube Athlete Hall of Fame, Pt. 1

HSAC would like to express its solidarity with the students on campus currently slaving away at their studies. We now present a brief diversion for your Reading Period consumption: the first inaugural class of the YouTube Athlete Hall of Fame, dedicated to those athletes who honed their craft not to win games, but to produce incredible highlights for posterity to view for eternity.

Andrew Mooney: For God’s sake, it’s a highlight reel of 100 dunks from the same dude, and they’re all just awesome. Look at the form on that windmill. It can’t be duplicated: the speed, the full arm extension, the perfectly round arc it traces in the air. Vince Carter was put on this Earth to stuff round things into slightly larger round holes and send them bouncing all over hardwood surfaces, the perfect combination of grace, power, and style. And, I mean, Frederic Weis (9:34)…it’s a testament to French pacifism that they didn’t immediately initiate a retaliatory missile strike for that assault. That’s one of their citizens Carter murdered.

Anthony Zonfrelli: Shawn Kemp may have been the baddest dog ever to play in the NBA. You can feel the primal satisfaction each time he throws down a monster jam or swats a shot into oblivion. The disrespect he shows defenders when embarrassing them with a posterization makes the aggressive, hard-core rap backing track all too appropriate. The only thing rivaling the fury with which he throws down each dunk is the humiliation he makes the defense feel afterward (0:52).

Nick Jaroszewicz: Here’s one for the rafters. High school football highlight tapes don’t get much better than Sam McGuffie, who took YouTube by storm during its “infancy” in 2007. With 3.15 million views today, many people have seen McGuffie elude, knock over, carry, and occasionally hurdle would-be tacklers. After struggling at Michigan, McGuffie found a place at Rice, where he showed a few flashes of his greatness, and was recently picked up by the Raiders, whose insatiable desire for speed and flash seems to persist, even with the passing of Al Davis.

Andrew Mooney: When you re-watch videos like these, you can understand why Texans fans rent their garments when their team passed on Reggie Bush for Mario Williams with the No. 1 pick. He’s a video game character. I remember watching that full-speed hurdle at 0:22 live and laughing gleefully that the underworld had spat up its running back demon to afflict the hated Irish of Notre Dame. After treating the likes of Fresno State and UCLA as rudely as he did, he must have thought he’d rush for 4,500 yards a year in the NFL. He should have five Heismans.

Anthony Zonfrelli: Some entertaining highlight reels are only possible because of “Big Fish-Small Pond” Syndrome, a classic affliction of the high school athlete video mashup. While this tape may be another one of those culprits, this fish doesn’t even fit in the pond. In this video, Seventh Woods, listed at 6’2″, 170 pounds, is shown dominating his high school league…at the age of 14. Though it may not be as “impressive” to see somebody that large continuously dunk over his short white peers, who doesn’t like to see armpit blocks (0:32), MJ-like free-throw tip slams (0:33), and behind-the-backboard shots reminiscent of Larry Bird (0:57)? Let’s hope there’s an Eighth.

Posted in Uncategorized | 2 Comments